
Our unique selling point
Consistent, uninterrupted Earth Intelligence data.
Aspia
Land Token
The ALT provides a clear snapshot of what is happening on a specific piece of land at a given moment in time.
Baseline tells how to classify.
Pulse tells you when to act
Baseline
What is each parcel of land capable of producing?
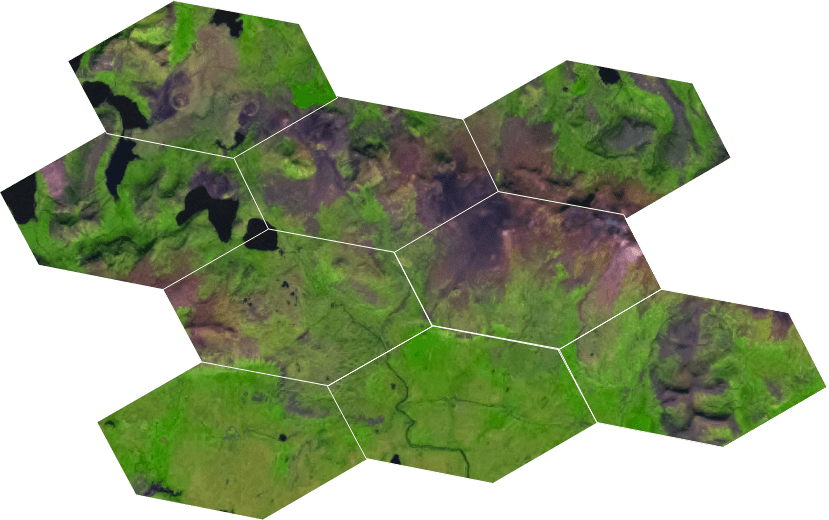
10-year historical behaviour of key observational indices tracing vegetation vigour, soil and water for each parcel of land
- 10 years of continuous history per field
- Proven yield capacity - the productive ceiling
- Growing condition classification
- Historical volatility and relative risk profile
- Persistent signatures of over/under-performance
Pulse
How is each parcel of land performing right now?
Take new observations and puts them in the context of the baseline. Is current behaviour expected or anomalous?
- Land Performance Index How close is growth to peak capacity?
- Performance Anomaly Index Are growth patterns and conditions anomalous?
- Stress Depth Index How severe are any deviations from the norm?
The industry challenge
What would you do differently if you could see your entire land portfolio, continuously, accurately, and in near-real time?
For land managers
Know exactly how every parcel in your portfolio is performing, ranked against its own decade-long baseline. Identify underperformance before it becomes a loss. Predict yield months in advance. Aspia’s Land Performance indices benchmark every parcel of land continuously, not annually.
For financial services and insurers
Price land risk accurately. Understand productive capacity, climate exposure, and performance trajectory before you commit capital. Aspia delivers the verified, audit-ready intelligence that turns land from an opaque asset into a transparent one.
For data resellers and platforms
Embed continuously updated, ground-truth validated land intelligence into your products via API. Standardised, stackable Aspia Land Tokens —ready to integrate at any scale, from single fields to entire nations.